Application Note
Computing the Power Spectrum in C#
We’ve had several customers ask about computing the PSD in C# with NMath, so I thought it was time for a post on the subject. The power spectral density provides an estimate of the power present within each slice of spectrum, and is presented as graph of the signal power versus frequency. It’s a common signal processing calculation across many fields from acoustics to chemistry, and can provide insight into periodicities contained within a time domain signal.
For stationary, square summable-signals, the PSD is expressed as,
where F(w) is the Fourier transform of the time domain signal f(t), and T is the width of the time domain sampled signal. Naturally we can never sample the entire signal, so calculations of the PSD (power spectrum density) are all estimates. Techniques for estimating the PSD can be divided into two classes, parametric (model based), and non-parametic (non-model based). We will discuss only non-parametic techniques here. For discrete signals that are not square-summable (i.e. non-stationary signals – and so the Fourier transform does not exist), estimates of the power spectral density can be derived from,
Which is the Fourier transform of the autocorrelation as the correlation width of the sampled signal tends to infinity. For a concise derivation of both of these formulas read these short lecture notes.
Computing the PSD in C# with NMath
Concentrating on stationary (periodic) signals, the PSD is most efficiently computed by applying smoothing to discrete periodograms .
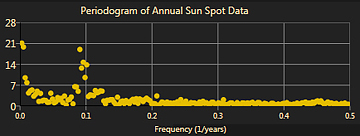
Where n is the number of signal samples. Each point in the periodogram represents the relative contribution to the variance in the time domain signal at that frequency. (Visualization provided courtesy of Infragistics.)

Another estimation technique involves computing multiple windowed periodograms and then combining these together to get a progressively more accurate estimate (Welch’s Method, similarly MTM with Slepian windows). The time domain signal should be detrended before any of these operations.
The following C# code estimates the PSD by smoothing the periodogram using a Savitzy-Golay zero phase shift filter.
using CenterSpace.NMath.Core;

/* Estimate the Power Spectrum Density in C# / .NET */
public DoubleVector PSDEstimate(DoubleVector signal)
{
  // Detrend the periodic data
  signal = signal - NMathFunctions.Mean(signal);

  // Compute the periodogram
  var forwardFFT = new DoubleForward1DFFT( signal.Length);
  var packedFFT = forwardFFT.FFT( signal );
  DoubleSymmetricSignalReader reader = forwardFFT.GetSignalReader( packedFFT );
  DoubleComplexVector fft = reader.UnpackSymmetricHalfToVector();

  // Square of the absolute value, scale the result by the length, 1/N.
  DoubleVector pg = NMathFunctions.Pow( NMathFunctions.Abs(fft), 2.0) / fft.Length;

  // Smooth w/ filter of width of 7, & polynomial degree of 5.
  var sgf = new SavitzkyGolayFilter(3, 3, 5);
  DoubleVector smoothedPSD = sgf.Filter(pg);

  return smoothedPSD;
}
Or using a Daniell filter and the MovingWindowFilter class to smooth the periodogram.
MovingWindowFilter mwf =
  new MovingWindowFilter(2, 2, new DoubleVector(.125, .25, .25, .25, .125));
mwf.WindowBoundaryOption =
  MovingWindowFilter.BoundaryOption.PadWithZeros;

DoubleVector smoothedPSDaniell = mwf.Filter(data);
More information about NMath’s FFT class set can be found on our fft landing page. The class The class SavitzkyGolayFilter will be avaliable in our next release, however, current users can use the MovingWindowFilter class with Savitzky-Golay coefficients generated via a provided helper method.SavitzyGolayFilter is available in the current release.
Happy Computing,
Paul
References
Haykin, S. “Adaptive Filter Theory”. Prentice-Hall, Inc. 1996.
