Visualization

NMath Charts in WPF

The NMathChart adapter class makes it easy to generate visualizations of NMath data in as little as one line of code.  The Chart class that is created is a Windows Forms control, but this control can be included in a Windows Presentation Foundation application by using the WindowsFormsHost element. To do so: Add references to these namespaces: System.Windows.Forms System.Windows.Forms.Integrat...
Read More

Distribution Fitting Demo

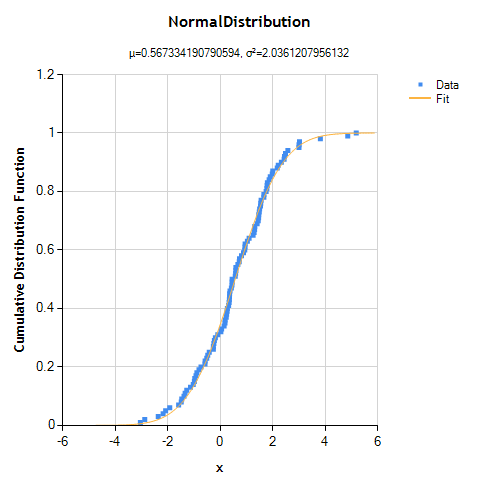
CDF() of fitted distribution
A customer recently asked how to fit a normal (Gaussian) distribution to a vector of experimental data. Here's a demonstration of how to do it. Let's start by creating a data set: 100 values drawn from a normal distribution with known parameters (mean = 0.5, variance = 2.0). int n = 100; double mean = .5; double variance = 2.0; var data = new DoubleVector( n, new RandGenNormal( mean, variance ) )...
Read More

The Importance of Graphing Your Data

In his classic book The Visual Display of Quantitative Information, Edward R. Tufte argued that "graphics can be more precise and revealing than conventional statistical computations". As an example, he described Anscombe's Quartet--four datasets that have identical simple statistical properties, yet appear very different when graphed. These data sets--each consisting of 11 x,y points--were con...
Read More

NMath integration with Essential Chart

When building numerical applications, you'll inevitably be faced with the challenge of taking raw data and computed results and presenting information in a way that makes business sense to the end user. NMath 5.1 added some new visualization features to help. We've also worked closely with the team at Syncfusion to make it very easy to create visualizations of NMath data with their powerful Essent...
Read More
Top