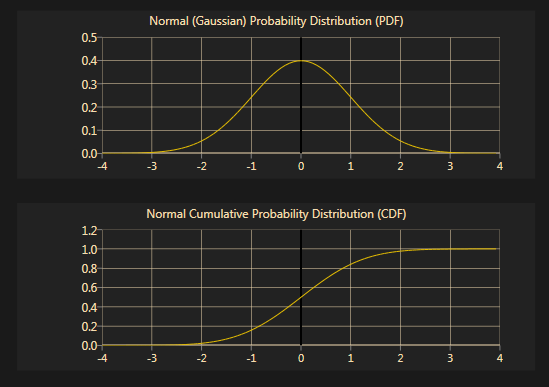
Probability distributions are central to many applications in statistical analysis. The NMath Stats library offers a large set of probability distributions, covering most domains of application, all with an easy to use common interface. Each distribution class uses numerically stable accurate algorithms to compute both the probability distribution and the cumulative distribution. In this post we’ll look at some code examples using these distribution classes. All of the charts in this post were generated using the Infragistics WPF tool set.
Available Distributions
The NMath Stats library offers the following set of probability distributions, with each name linked to their API documentation page. More information can be found on the CenterSpace probability distribution landing page, including links to code examples in C# and VB, and more documentation.
Distribution of Running Times
Corvallis hosts many foot races during the year, and this application note analyzes the finishing times data from two of those: the annual Fall Festival 10K Fun Run, and the one-off Strands 5K. The central limit theorem tells us to expect the running times for a foot race (of enough participants) to be normally distributed. But what happens to that distribution when a large prize is offered? The Fall Festival 10K Fun Run offers a prize of exactly $0, where the Strands 5K offered an amazing $10,000 prize.
We can estimate a normal distribution from the two data sets, and then use a Kolmogorov-Smirnov test to determine if the distribution passed the K-S null hypothesis. If the Kolmogorov-Smirnov null hypothesis is not rejected, then under this statistic, the data points are said to be drawn from the reference distribution (in this case the normal distribution).
using System.IO;
using CenterSpace.NMath.Core;
using CenterSpace.NMath.Stats;

public Main()
{
  // Load fall festival 10K data and strands 5K data
  StreamReader reader = new StreamReader("fall_festival_times.txt", false);
  DoubleVector fallfestival10k = new DoubleVector(reader);

  reader = new StreamReader("strands_times.txt", false);
  DoubleVector strands10k = new DoubleVector(reader);

  // Estimate Normal (Gaussian) Distributions and
  // check the Kolmogorov-Smirnov Test
  NormalDistribution ndist_ff = new NormalDistribution(
    StatsFunctions.Mean(fallfestival10k), StatsFunctions.Variance(fallfestival10k));
  OneSampleKSTest kstest = new OneSampleKSTest(fallfestival10k, ndist_ff);
  bool rejectNH = kstest.Reject; // False

  NormalDistribution ndist_s = new NormalDistribution(
    StatsFunctions.Mean(strands10k), StatsFunctions.Variance(strands10k));
  kstest = new OneSampleKSTest(strands10k, ndist_s);
  rejectNH = kstest.Reject;  // True
}
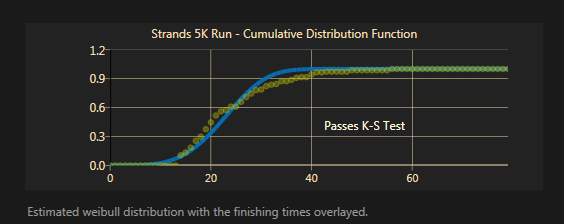
A look at the data makes the results of the Kolmogorov-Smirnov test look plausible.

The Strand 5K finishing times are not normally distributed because the big prize prompted many fast runners to show up and many average runners to enjoy the race from the sidelines. This grouped the finishing times around the winner (many close finishers) and so they were no longer normally distributed. This distribution looks more like a Weibull and we can test against that intuition with the code snippit.
  WeibullDistribution wdist_s = new WeibullDistribution(25,4);

  kstest = new OneSampleKSTest(strands10k, wdist_s);
  rejectNH = kstest.Reject; // now False
Let’s look at the CDF of this weibull versus the data again.

Simple Coin Flipping Example
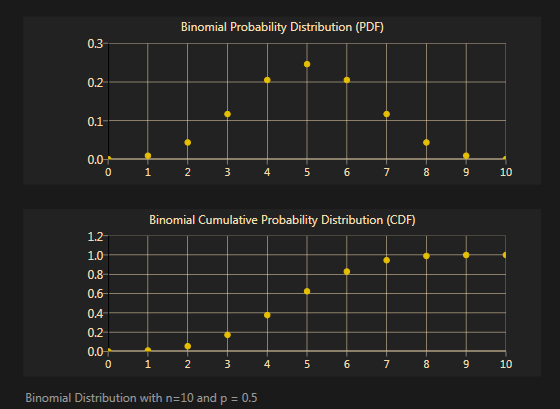
I’ll present one more simple example using a discrete distribution. The binomial distribution is used for modeling most coin flipping games, as it represents the distribution of successes in a sequence of independent yes/no questions. The binomial distribution is parametrized on the number of trials n, and the probability of each independent success, p. For example, using this binomial distribution we can model, say, the number of heads founds in a sequence of 10 coin flips, using n=10 and p=1/2

As expected, the most likely number of heads would occur at 5 (with a probability of 0.246), and the probability of either getting 3, 4, 5, or 6 heads in 10 flips would be the difference of the CDF at 6 and 3, equal to 0.656. Below is the simple C# code used to compute the answers to these questions.
using CenterSpace.NMath.Core;
using CenterSpace.NMath.Stats;

public Main()
{
  int number_of_trials = 10;
  int prob_of_success = 0.5;
  BinomialDistribution dist =
    new BinomialDistribution(number_of_trials, prob_of_success);

  // Probability of landing 5 heads in 10 flips ( = 0.246)
  Double five_heads = dist.PDF(5);

  // Probability of landing 3, 4, 5, or 6 heads in 10 flips ( = 0.656)
  Double three_to_six_heads = dist.CDF(6) - dist.CDF(3);
}
I hope these code examples can help you get started using the NMath Stats distribution classes quickly and correctly.
-Happy Computing,
Paul
