1.11 Visualization (.NET, C#, CSharp, VB, Visual Basic, F#)
NMath can be easily combined with the free Microsoft Chart Controls for .NET to create a complete data analysis and visualization solution. The Microsoft Chart Controls for .NET are available as a separate download for .NET 3.5. Beginning in .NET 4.0, the Chart controls are part of the .NET Framework.
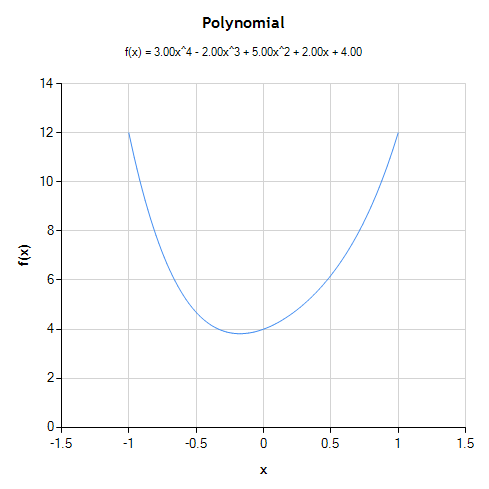
NMath provides convenience methods for plotting NMath types using the Microsoft Chart Controls. For example, this code plots a polynomial by interpolating over the specified range:
Code Example – C# charts
var poly = new Polynomial( new DoubleVector( 4, 2, 5, -2, 3 ) );
double xmin = -1;
double xmax = 1;
int numInterpolatedValues = 100;
NMathChart.Show( poly, xmin, xmax, numInterpolatedValues );
Code Example – VB charts
Dim Poly As New Polynomial(New DoubleVector(4, 2, 5, -2, 3))
Dim XMin As Double = -1
Dim XMAx As Double = 1
Dim NumInterpolatedValues As Integer = 100
NMathChart.Show(Poly, XMin, XMAx, NumInterpolatedValues)
Figure 1 – Plotted polynomial
For more information, see the CenterSpace whitepaper "NMath Visualization Using the Microsoft Chart Controls."