Discrete time wavelet transforms have found engineering applications in computer vision, pattern recognition, signal filtering and perhaps most widely in signal and image compression. In 2000 the ISO JPEG committee proposed a new JPEG2000 image compression standard that is based on the wavelet transform using two Daubechies wavelets. This standard made the relatively new image decomposition algorithm ubiquitous on desktops around the world.
In signal processing, wavelets have been widely investigated for use in filtering bio-electric signals, among many other applications. Bio-electric signals are good candidates for multi-resolution wavelet filtering over standard Fourier analysis due to their non-stationary character. In this article we’ll discuss the filtering of electrocardiograms or ECGs and demonstrate with code examples how to filter an ECG waveform using NMath‘s new wavelet classes; keeping in mind that the techniques and code shown here apply to a wide class of time series measurements. If wavelets and their applications to filtering are unfamiliar to the reader, read a gentle and brief introduction to the subject in Wavelets for Kids: A Tutorial Introduction [5].
Filtering a Time Series with Wavelets
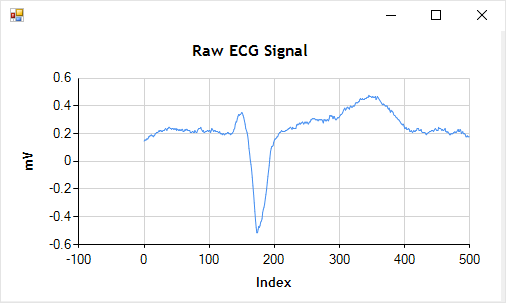
PhysioNet provides free access to a large collections of recorded physiologic signals, including many ECG’s. The ECG signal we will filter here, named aami-ec13 on PhysioNet, is shown below.
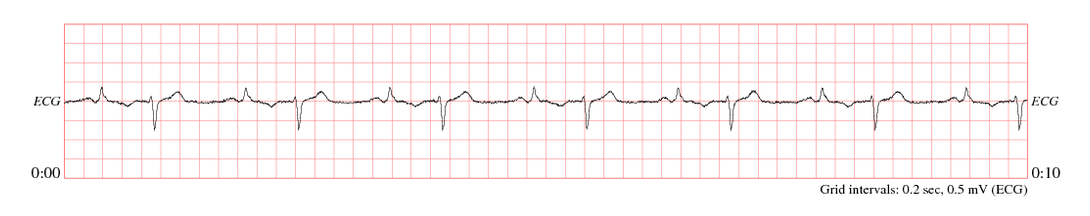
Our goal will be to remove the high frequency noise while preserving the character of the wave form, including the high frequency transitions at the signal peaks. Fourier based filter methods are ill suited for filtering this type of signal due to both it’s non-stationarity, as mentioned, but also the need to preserve the peak locations (phase) and shape.
A Wavelet Filter
As with Fourier analysis there are three basic steps to filtering signals using wavelets.
- Decompose the signal using the DWT.
- Filter the signal in the wavelet space using thresholding.
- Invert the filtered signal to reconstruct the original, now filtered signal, using the inverse DWT.
Briefly, the filtering of signals using wavelets is based on the idea that as the DWT decomposes the signal into details and approximation parts, at some scale the details contain mostly the insignificant noise and can be removed or zeroed out using thresholding without affecting the signal. This idea is discussed in more detail in the introductory paper [5]. To implement this DWT filtering scheme there are two basic filter design parameters: the wavelet type and a threshold. Typically the shape and form of the signal to be filtered is qualitatively matched to the general shape of the wavelet. In this example we will use the Daubechies forth order wavelet.
 |
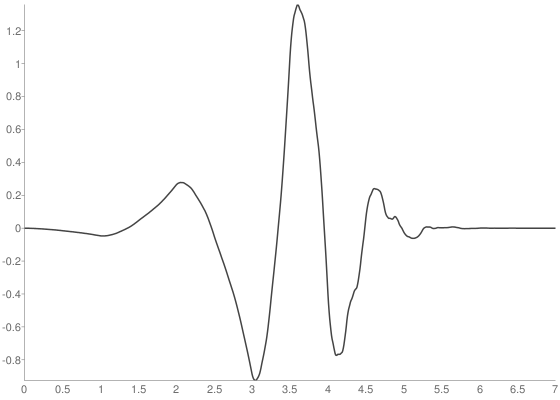 |
The general shape of this wavelet roughly matches, at various scales, the morphology of the ECG signal. Currently NMath supports the following wavelet families: Harr, Daubechies, Symlet, Best Localized, and Coiflet, 27 in all. Additionally, any custom wavelet of your invention can be created by passing in the wavelet’s low & high pass decimation filter values. The wavelet class then imposes the wavelet’s symmetry properties to compute the reconstruction filters.
   // Build a Coiflet wavelet.
   var wavelet = new FloatWavelet( Wavelet.Wavelets.C4 );

   // Build a custom reverse bi-orthogonal wavelet.
   var wavelet = new DoubleWavelet( new double[] {0.0, 0.0, 0.7071068, 0.7071068, 0.0, 0.0}, new double[] {0.0883883, 0.0883883, -0.7071068, 0.7071068, -0.0883883, -0.0883883} );
The FloatDWT class provides four different thresholding strategies: Universal, UniversalMAD, Sure, and Hybrid (a.k.a SureShrink). We’ll use the Universal threshold strategy here. This is a good starting point but this strategy can over smooth the signal. Typically some empirical experimentation is done here to find the best threshold for the data (see [1], also see [4] for a good overview of common thresholding strategies.)
Wavelet Filtering Code
The three steps outlined above are easily coded using two classes in the NMath library: the FloatDWT class and the FloatWavelet class. As always in NMath, the library offers both a float precision and a double precision version of each of these classes. Let’s look at a code snippet that implements a DWT based filter with NMath.
   // Choose wavelet, the Daubechies 4 wavelet
   var wavelet = new FloatWavelet( Wavelet.Wavelets.D4 );

   // Build DWT object using our wavelet & data
   var dwt = new FloatDWT( data, wavelet );

   // Decompose signal with DWT to level 5
   dwt.Decompose( 5 );

   // Find Universal threshold & threshold all detail levels
   double lambdaU = dwt.ComputeThreshold( FloatDWT.ThresholdMethod.Universal, 1 );
   dwt.ThresholdAllLevels( FloatDWT.ThresholdPolicy.Soft, new double[] { lambdaU,
       lambdaU, lambdaU, lambdaU, lambdaU } );

   // Rebuild the filtered signal.
   float[] reconstructedData = dwt.Reconstruct();
The first two lines of code build the wavelet object and the DWT object using both the input data signal and the abbreviated Daubechies wavelet name Wavelet.Wavelets.D4. The third line of code executes the wavelet decomposition at five consecutive scales. Both the signal’s details and approximations are stored in the DWT object at each step in the decomposition. Next, the Universal threshold is computed and the wavelet details are thresholded using the same threshold with a Soft policy (see [1], pg. 63). Lastly, the now filtered signal is reconstructed.
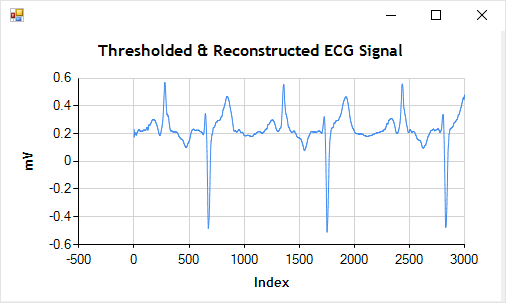
Below, the chart on the left shows the unfiltered ECG signal and the chart on the right shows the wavelet filtered ECG signal. It’s clear that this filter very effectively removed the noise while preserving the signal.
 |
 |
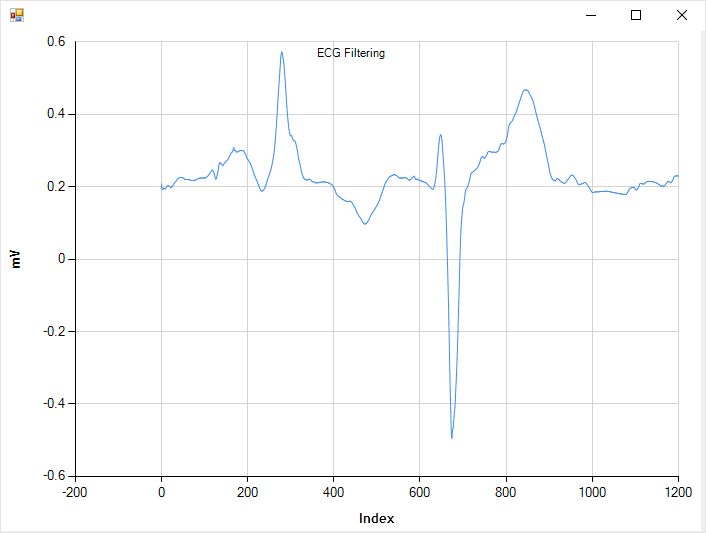
These two charts below show a detail from the chart above from indices 500 to 1000. Note how well the signal shape, phase, and amplitude has been preserved in this non-stationary wavelet-filtered signal.
 |
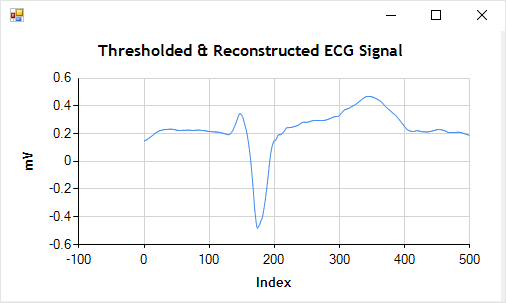 |
It is this ability to preserve phase, form, and amplitude in DWT based filters all while having a O(n log n) runtime that Fourier-based filters enjoy that has made wavelets such an important part of signal processing today. The complete code for this example along with a link to the ECG data is provided below.
Paul
References
Test Data
To copy the data file provided by PhysioNet for this example click: ECG_AAMIEC13.data
This ECG data was taken from the ANSI EC13 test data set waveforms.
Complete Test Code
    public void BlogECGExample()
    {
      // Define your own dataDir
      var dataDir = "................";

      // Load ECG wave from physionet.org data file.
      string filename = Path.Combine( dataDir, "ECG_AAMIEC13.data.txt" );
      string line;
      int cnt = 0;
      FloatVector ecgMeasurement = new FloatVector( 3000 );
      var fileStrm = new System.IO.StreamReader( filename );
      fileStrm.ReadLine(); fileStrm.ReadLine();
      while ( ( line = fileStrm.ReadLine() ) != null && cnt < 3000 )
      {
        ecgMeasurement[cnt] = Single.Parse( line.Split( ',' )[1] );
        cnt++;
      }

      // Choose wavelet
      var wavelet = new FloatWavelet( Wavelet.Wavelets.D4 );

      // Build DWT object
      var dwt = new FloatDWT( ecgMeasurement.DataBlock.Data, wavelet );

      // Decompose signal with DWT to level 5
      dwt.Decompose( 5 );

      // Find Universal threshold & threshold all detail levels with lambdaU
      double lambdaU = dwt.ComputeThreshold( FloatDWT.ThresholdMethod.Universal, 1 );
      dwt.ThresholdAllLevels( FloatDWT.ThresholdPolicy.Soft, new double[] { lambdaU, lambdaU, lambdaU, lambdaU, lambdaU } );

      // Rebuild the signal to level 1 - the original (filtered) signal.
      float[] reconstructedData = dwt.Reconstruct();

      // Display DWT results.
      BlogECGExampleBuildCharts( dwt, ecgMeasurement, reconstructedData );

    }

    public void BlogECGExampleBuildCharts( FloatDWT dwt, FloatVector ECGMeasurement, float[] ReconstructedData )
    {

      // Plot out approximations at various levels of decomposition.
      var approxAllLevels = new FloatVector();
      for ( int n = 5; n > 0; n-- )
      {
        var approx = new FloatVector( dwt.WaveletCoefficients( DiscreteWaveletTransform.WaveletCoefficientType.Approximation, n ) );
        approxAllLevels.Append( new FloatVector( approx ) );
      }

      var detailsAllLevels = new FloatVector();
      for ( int n = 5; n > 0; n-- )
      {
        var approx = new FloatVector( dwt.WaveletCoefficients( DiscreteWaveletTransform.WaveletCoefficientType.Details, n ) );
        detailsAllLevels.Append( new FloatVector( approx ) );
      }

      // Create and display charts.
      Chart chart0 = NMathChart.ToChart( detailsAllLevels );
      chart0.Titles.Add( "Concatenated DWT Details to Level 5" );
      chart0.ChartAreas[0].AxisY.Title = "DWT Details";
      chart0.Height = 270;
      NMathChart.Show( chart0 );

      Chart chart1 = NMathChart.ToChart( approxAllLevels );
      chart1.Titles.Add("Concatenated DWT Approximations to Level 5");
      chart1.ChartAreas[0].AxisY.Title = "DWT Approximations";
      chart1.Height = 270;
      NMathChart.Show( chart1 );

      Chart chart2 = NMathChart.ToChart( (new FloatVector( ReconstructedData ))[new Slice(500,500)] );
      chart2.Titles[0].Text = "Thresholded & Reconstructed ECG Signal";
      chart2.ChartAreas[0].AxisY.Title = "mV";
      chart2.Height= 270;
      NMathChart.Show( chart2 );

      Chart chart3 = NMathChart.ToChart( (new FloatVector( ECGMeasurement ))[new Slice(500,500)] );
      chart3.Titles[0].Text = "Raw ECG Signal";
      chart3.ChartAreas[0].AxisY.Title = "mV";
      chart3.Height = 270;
      NMathChart.Show( chart3 );

    }