
Chromatographic and Spectographic Data Analysis
Chromatographic and spectographic data analysis is a common application of the NMath class library and usually involves some or all of the following computing activities: Noise removalBaseline adjustmentPeak findingPeak modeling Peak statistical analysis ...
Read More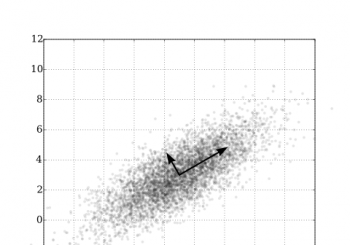
Principal Components Regression: Part 3 – The NIPALS Algorithm
Principal Components Regression: Recap of Part 2 Recall that the least squares solution to the multiple linear problem is given by(1) $latex \hat{\beta} = (X^T X)^{-1} X^T y $ And that problems occurred finding when the matrix(2) was close to bei...
Read More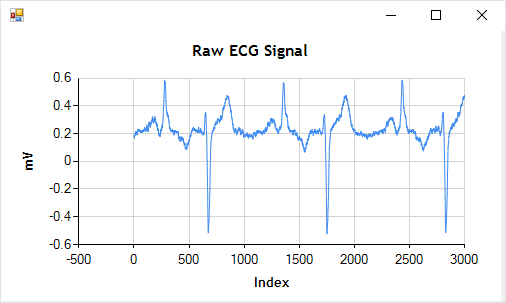
Filtering with Wavelet Transforms
Discrete time wavelet transforms have found engineering applications in computer vision, pattern recognition, signal filtering and perhaps most widely in signal and image compression. In 2000 the ISO JPEG committee proposed a new JPEG2000 image compression st...
Read More