In 2007, Microsoft acquired the Dundas chart components, in order to deliver data visualization directly within Microsoft products. In October 2008, they released the Microsoft Chart Controls for .NET, which includes the Dundas ASP.NET and Windows Forms Chart controls. The Chart controls are available as a separate download for .NET 3.5. Beginning in .NET 4.0, the Chart controls are part of the .NET Framework. To use the Chart controls, add a reference to System.Windows.Forms.DataVisualization.
A Chart object contains one or more ChartAreas, each of which contain one or more data Series. Each Series has an associated chart type, and a DataPoint collection. DataPoints can be manually appended or inserted into the collection, or added automatically when a series is bound to a datasource using either the DataBindY() or DataBindXY() method. Since any IEnumerable can act as a datasource, it’s easy to use an NMath vector or vector view (of a matrix row or column, for example) as a datasource.
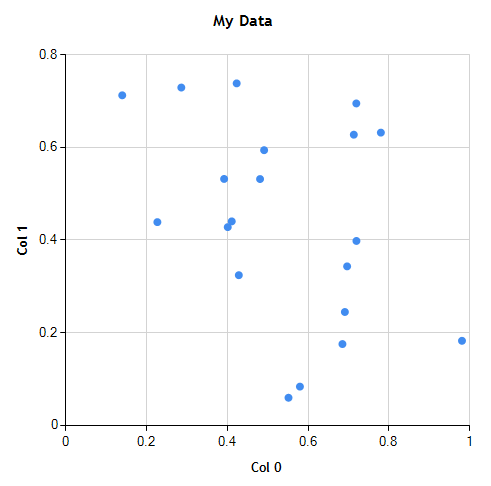
For example, suppose we want to create a scatter plot of the first two columns of a 20 x 5 DoubleMatrix (that is, column 0 vs. column 1).
DoubleMatrix data = new DoubleMatrix( 20, 5, new RandGenUniform() );
DoubleVector x = data.Col( 0 );
DoubleVector y = data.Col( 1 );
Begin by creating a new Chart object, and optionally adding a Title.
Chart chart = new Chart()
{
  Size = new Size( 500, 500 ),
};

Title title = new Title()
{
  Name = chart.Titles.NextUniqueName(),
  Text = "My Data",
  Font = new Font( "Trebuchet MS", 12F, FontStyle.Bold ),
};
chart.Titles.Add( title );
Next, add a ChartArea.
ChartArea area = new ChartArea()
{
  Name = chart.ChartAreas.NextUniqueName(),
};
area.AxisX.Title = "Col 0";
area.AxisX.TitleFont = new Font( "Trebuchet MS", 10F, FontStyle.Bold );
area.AxisX.MajorGrid.LineColor = Color.LightGray;
area.AxisX.RoundAxisValues();
area.AxisY.Title = "Col 1";
area.AxisY.TitleFont = new Font( "Trebuchet MS", 10F, FontStyle.Bold );
area.AxisY.MajorGrid.LineColor = Color.LightGray;
area.AxisY.RoundAxisValues();
chart.ChartAreas.Add( area );
Finally, add a new data Series, and bind the datasource to the NMath x,y vectors.
Series series = new Series()
{
  Name = "Points",
  ChartType = SeriesChartType.Point,
  MarkerStyle = MarkerStyle.Circle,
  MarkerSize = 8,
};
series.Points.DataBindXY( x, y );
chart.Series.Add( series );
To display the chart, we can use a utility function like this, which shows the given chart in a default form running in a new thread.
public static void Show( Chart chart )
{
  Form form = new Form();
  form.Size = new Size( chart.Size.Width + 20, chart.Size.Height + 40 );
  form.Controls.Add( chart );
  Thread t = new Thread( () => Application.Run( form ) );
   t.Start();
}
After calling
Show( chart );
the result looks like this:
Of course, you can easily plot more complicated data as well. For instance, suppose we fit a 4th degree polynomial to this (random) data:
int degree = 4;
PolynomialLeastSquares pls = new PolynomialLeastSquares( degree, x, y );
To add the fitted polynomial to the cart, just add a new data Series interpolating over the range of x values.
Series series2 = new Series()
{
  Name = "Polynomial",
  ChartType = SeriesChartType.Line,
  MarkerStyle = MarkerStyle.None,
};
int numInterpolatedValues = 100;
double xmin = NMathFunctions.MinValue( x );
double xmax = NMathFunctions.MaxValue( x );
double step = ( xmax - xmin ) / ( numInterpolatedValues - 1 );
DoubleVector xi = new DoubleVector( numInterpolatedValues, xmin, step );
series2.Points.DataBindXY( xi, pls.FittedPolynomial.Evaluate( xi ) );
chart.Series.Add( series2 );
Let’s also add a subtitle with the fitted function, and a Legend.
Title subtitle = new Title()
{
  Name = chart.Titles.NextUniqueName(),
  Text = "f(x) = " + pls.FittedPolynomial.ToString( "N2" ),
};
chart.Titles.Add( subtitle );

Legend legend = new Legend()
{
  Name = chart.Legends.NextUniqueName(),
  DockedToChartArea = chart.ChartAreas[0].Name,
};
chart.Legends.Add( legend );
Now the chart looks like this:

If you add a Chart control to your application using the visual designer (by dragging a Chart control from the Data category in the Toolbox), this generates code to create a default Chart, with a single ChartArea, Series, and Legend. You can then edit the properties in the Properties tab, and bind the generated Series to an NMath datasource. For example:
public Form1()
{
  InitializeComponent();

  DoubleMatrix data = new DoubleMatrix( 20, 5, new RandGenUniform() );
  this.chart1.Series[0].Points.DataBindXY( data.Col(0), data.Col(1) );
}
The Microsoft Chart Controls for .NET provide an easy (and free) solution for visualizing NMath numerical types.
Ken

